

Journal of Clinical Pediatrics ›› 2024, Vol. 42 ›› Issue (4): 297-304.doi: 10.12372/jcp.2024.23e0852
• Original Article • Previous Articles Next Articles
DAI Nini, GAO Yajuan, SUN Jinbo, ZHANG Juan, LI Zailing( )
)
Received:2023-09-05
Published:2024-04-15
Online:2024-04-09
DAI Nini, GAO Yajuan, SUN Jinbo, ZHANG Juan, LI Zailing. The dynamic changes and application value of MUC2 and sIgA in intestinal mucus layer of infants with food allergy[J].Journal of Clinical Pediatrics, 2024, 42(4): 297-304.
"
"
| 项 目 | 总体(n=104) | 过敏组(n=52) | 对照组(n=52) | 统计值 | P |
|---|---|---|---|---|---|
| 入组年龄[M(P25~P75)/月] | 4.10(3.00~5.93) | 3.90(2.83~5.33) | 4.30(4.00~6.00) | Z=1.56 | 0.119 |
| 性别[n(%)] | χ2=0.35 | 0.556 | |||
| 男 | 49(47.12%) | 23(44.23%) | 26(50.00%) | ||
| 女 | 55(52.88%) | 29(55.77%) | 26(50.00%) | ||
| 出生方式[n(%)] | χ2=0.04 | 0.842 | |||
| 剖宫产 | 43(41.35%) | 22(42.31%) | 21(40.38%) | ||
| 经阴分娩 | 61(58.65%) | 30(57.69%) | 31(59.62%) | ||
| 喂养方式[n(%)] | - | 0.4861) | |||
| 纯母乳喂养 | 48(46.15%) | 27(51.92%) | 21(40.38%) | ||
| 人工喂养 | 3(2.89%) | 1(1.92%) | 2(3.85%) | ||
| 混合喂养 | 53(50.96%) | 24(46.16%) | 29(55.77%) | ||
| 入组时辅食添加情况 | χ2=3.47 | 0.063 | |||
| 已添加 | 24(23.08%) | 8(15.38%) | 16(30.77%) | ||
| 未添加 | 80(76.92%) | 44(84.62%) | 36(69.23%) | ||
| 一级亲属过敏性疾病家族史[n(%)] | χ2=3.21 | 0.073 | |||
| 无 | 43(41.35%) | 17(32.69%) | 26(50.00%) | ||
| 有 | 61(58.65%) | 35(67.31%) | 26(50.00%) |
"
"
| 临床表现 | 入组时 | 治疗2周 | 治疗4周 |
|---|---|---|---|
| 皮疹SCORAD评分[M(P25~P75)] | 7.30(0.00~21.30) | 0.00(0.00~0.00) | 0.00(0.00~0.00) |
| 腹泻/% | 94.23% | 36.67% | 7.69% |
| 便血/% | 88.46% | 26.67% | 11.54% |
| 黏液便/% | 94.23% | 30.00% | 7.69% |

"
"
"
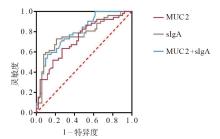
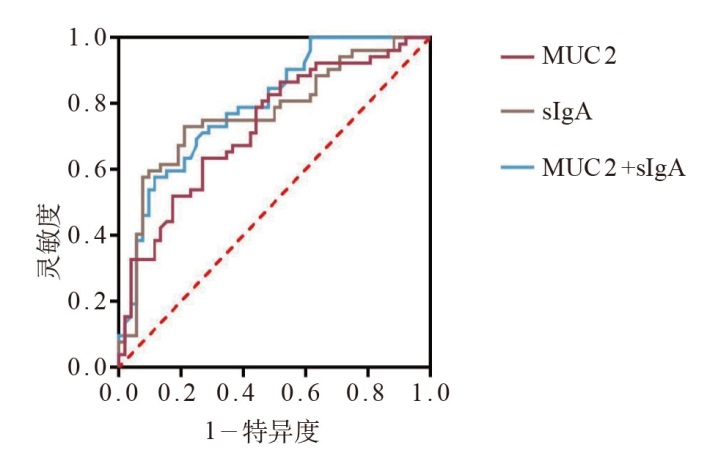
| 目标标志物 | AUC(95%CI) | P值 | 灵敏度 | 特异度 | Cut-off值/μg·mL-1 |
|---|---|---|---|---|---|
| 粪便MUC2 | 0.728(0.632~0.825) | <0.001 | 0.635 | 0.731 | 34.16 |
| 粪便sIgA | 0.769(0.676~0.862) | <0.001 | 0.731 | 0.788 | 158.80 |
| 联合预测因子 | 0.794(0.709~0.879) | <0.001 | 0.577 | 0.885 | 0.37 |
"
"
| 自变量 | B | Wald χ2值 | P值 | OR值(95% CI) |
|---|---|---|---|---|
| 粪便MUC2 | 0.04 | 4.70 | 0.030 | 1.037(1.003~1.071) |
| 粪便sIgA | 0.03 | 10.05 | 0.002 | 1.028(1.011~1.046) |
| [1] |
Prescott SL, Pawankar R, Allen KJ, et al. A global survey of changing patterns of food allergy burden in children[J]. World Allergy Organ J, 2013, 6(1): 21.
doi: 10.1186/1939-4551-6-21 |
| [2] |
Sicherer SH, Sampson HA. Food allergy: epidemiology, pathogenesis, diagnosis, and treatment[J]. J Allergy Clin Immunol, 2014, 133(2): 291-307.
doi: 10.1016/j.jaci.2013.11.020 pmid: 24388012 |
| [3] |
Lopes JP, Sicherer S. Food allergy: epidemiology, pathogenesis, diagnosis, prevention, and treatment[J]. Curr Opin Immunol, 2020, 66: 57-64.
doi: S0952-7915(20)30037-6 pmid: 32446135 |
| [4] | Wang J, Zhou Y, Zhang H, et al. Pathogenesis of allergic diseases and implications for therapeutic interventions[J]. Signal Transduct Target Ther, 2023, 8(1): 138. |
| [5] |
Carroccio A, Scalici C, Maresi E, et al. Chronic constipation and food intolerance: a model of proctitis causing constipation[J]. Scand J Gastroenterol, 2005, 40(1): 33-42.
doi: 10.1080/00365520410009401 |
| [6] |
Johansson ME, Hansson GC. Immunological aspects of intestinal mucus and mucins[J]. Nat Rev Immunol, 2016, 16(10): 639-649.
doi: 10.1038/nri.2016.88 pmid: 27498766 |
| [7] |
Martens EC, Neumann M, Desai MS. Interactions of commensal and pathogenic microorganisms with the intestinal mucosal barrier[J]. Nat Rev Microbiol, 2018, 16(8): 457-470.
doi: 10.1038/s41579-018-0036-x pmid: 29904082 |
| [8] |
Tadesse S, Corner G, Dhima E, et al. MUC2 mucin deficiency alters inflammatory and metabolic pathways in the mouse intestinal mucosa[J]. Oncotarget, 2017, 8(42): 71456-71470.
doi: 10.18632/oncotarget.16886 pmid: 29069719 |
| [9] |
Velcich A, Yang W, Heyer J, et al. Colorectal cancer in mice genetically deficient in the mucin muc2[J]. Science, 2002, 295(5560): 1726-1729.
doi: 10.1126/science.1069094 pmid: 11872843 |
| [10] |
Paone P, Cani PD. Mucus barrier, mucins and gut microbiota: the expected slimy partners?[J]. Gut, 2020, 69(12): 2232-2243.
doi: 10.1136/gutjnl-2020-322260 pmid: 32917747 |
| [11] | 韩渤, 刘玥宏, 仇志强, 等. sIgA表达功能及其在肠道疾病的作用[J]. 世界华人消化杂志, 2017, 25(19): 1757-1763. |
| [12] |
Pietrzak B, Tomela K, Olejnik-Schmidt A, et al. Secretory IgA in intestinal mucosal secretions as an adaptive barrier against microbial cells[J]. Int J Mol Sci, 2020, 21(23): 9254.
doi: 10.3390/ijms21239254 |
| [13] | 中华医学会儿科学分会消化学组. 食物过敏相关消化道疾病诊断与管理专家共识[J]. 中华儿科杂志, 2017, 55(7): 487-492. |
| [14] | 周薇, 赵京, 车会莲, 等. 中国儿童食物过敏循证指南[J]. 中华实用儿科临床杂志, 2022, 37(8): 572-583. |
| [15] |
Severity scoring of atopic dermatitis: the SCORAD index. Consensus report of the European task force on atopic dermatitis[J]. Dermatology, 1993, 186(1): 23-31.
doi: 10.1159/000247298 |
| [16] |
Loktionov A, Chhaya V, Bandaletova T, et al. Assessment of cytology and mucin 2 in colorectal mucus collected from patients with inflammatory bowel disease: results of a pilot trial[J]. J Gastroenterol Hepatol, 2016, 31(2): 326-333.
doi: 10.1111/jgh.2016.31.issue-2 |
| [17] |
Parrish A, Boudaud M, Kuehn A, et al. Intestinal mucus barrier: a missing piece of the puzzle in food allergy[J]. Trends Mol Med, 2022, 28(1): 36-50.
doi: 10.1016/j.molmed.2021.10.004 |
| [18] |
Leon-Coria A, Kumar M, Workentine M, et al. Muc2 mucin and nonmucin microbiota confer distinct innate host defense in disease susceptibility and colonic injury[J]. Cell Mol Gastroenterol Hepatol, 2021, 11(1): 77-98.
doi: 10.1016/j.jcmgh.2020.07.003 pmid: 32659381 |
| [19] |
Van der Sluis M, De Koning BA, De Bruijn AC, et al. Muc2-deficient mice spontaneously develop colitis, indicating that MUC2 is critical for colonic protection[J]. Gastroenterology, 2006, 131(1): 117-129.
doi: 10.1053/j.gastro.2006.04.020 pmid: 16831596 |
| [20] |
Wenzel UA, Magnusson MK, Rydström A, et al. Spontaneous colitis in Muc2-deficient mice reflects clinical and cellular features of active ulcerative colitis[J]. PLoS One, 2014, 9(6): e100217.
doi: 10.1371/journal.pone.0100217 |
| [21] |
Bollrath J, Powrie FM. Controlling the frontier: regulatory T-cells and intestinal homeostasis[J]. Semin Immunol, 2013, 25(5): 352-357.
doi: 10.1016/j.smim.2013.09.002 pmid: 24184013 |
| [22] |
Shan M, Gentile M, Yeiser JR, et al. Mucus enhances gut homeostasis and oral tolerance by delivering immunoregulatory signals[J]. Science, 2013, 342(6157): 447-453.
doi: 10.1126/science.1237910 pmid: 24072822 |
| [23] |
Virta LJ, Ashorn M, Kolho KL. Cow's milk allergy, asthma, and pediatric IBD[J]. J Pediatr Gastroenterol Nutr, 2013, 56(6): 649-651.
doi: 10.1097/MPG.0b013e318285e9d8 |
| [24] | Wasielewska Z, Dolińska A, Wilczyńska D, et al. Prevalence of allergic diseases in children with inflammatory bowel disease[J]. Postepy Dermatol Alergol, 2019, 36(3): 282-290. |
| [25] |
Larsson JM, Karlsson H, Crespo JG, et al. Altered O-glycosylation profile of MUC2 mucin occurs in active ulcerative colitis and is associated with increased inflammation[J]. Inflamm Bowel Dis, 2011, 17(11): 2299-2307.
doi: 10.1002/ibd.21625 pmid: 21290483 |
| [26] |
Grondin JA, Kwon YH, Far PM, et al. Mucins in Intestinal mucosal defense and inflammation: learning from clinical and experimental studies[J]. Front Immunol, 2020, 11: 2054.
doi: 10.3389/fimmu.2020.02054 pmid: 33013869 |
| [27] | 李斐, 黎海芪. 卵清蛋白致敏小鼠肠道黏膜sIgA抗体反应的实验研究[J]. 中华儿科杂志, 2006, 44(4): 294-298. |
| [28] |
Sicherer SH, Sampson HA. Food allergy: a review and update on epidemiology, pathogenesis, diagnosis, prevention, and management[J]. J Allergy Clin Immunol, 2018, 141(1): 41-58.
doi: S0091-6749(17)31794-3 pmid: 29157945 |
| [29] |
Roth-Walter F, Berin MC, Arnaboldi P, et al. Pasteurization of milk proteins promotes allergic sensitization by enhancing uptake through Peyer's patches[J]. Allergy, 2008, 63(7): 882-890.
doi: 10.1111/j.1398-9995.2008.01673.x pmid: 18588554 |
| [30] |
Frossard CP, Hauser C, Eigenmann PA. Antigen-specific secretory IgA antibodies in the gut are decreased in a mouse model of food allergy[J]. J Allergy Clin Immunol, 2004, 114(2): 377-382.
doi: 10.1016/j.jaci.2004.03.040 |
| [31] |
Han B, Ma Y, Liu Y. Fucoxanthin Prevents the ovalbumin-Induced food allergic response by enhancing the intestinal epithelial barrier and regulating the intestinal flora[J]. J Agric Food Chem, 2022, 70(33): 10229-10238.
doi: 10.1021/acs.jafc.2c04685 |
| [32] |
Mestecky J, Russell MW, Elson CO. Intestinal IgA: novel views on its function in the defence of the largest mucosal surface[J]. Gut, 1999, 44(1): 2-5.
pmid: 9862815 |
| [33] |
Kukkonen K, Kuitunen M, Haahtela T, et al. High intestinal IgA associates with reduced risk of IgE-associated allergic diseases[J]. Pediatr Allergy Immunol, 2010, 21(1 Pt 1): 67-73.
doi: 10.1111/pai.2010.21.issue-1-Part-I |
| [34] |
Konstantinou GN, Bencharitiwong R, Grishin A, et al. The role of casein-specific IgA and TGF-β in children with food protein-induced enterocolitis syndrome to milk[J]. Pediatr Allergy Immunol, 2014, 25(7): 651-656.
doi: 10.1111/pai.2014.25.issue-7 |
|
||